GPT-5.6 Sol's Vision Is Quietly Its Most Underrated Feature — I Put It Through 40 Real Images
Why Vision Deserves More Attention
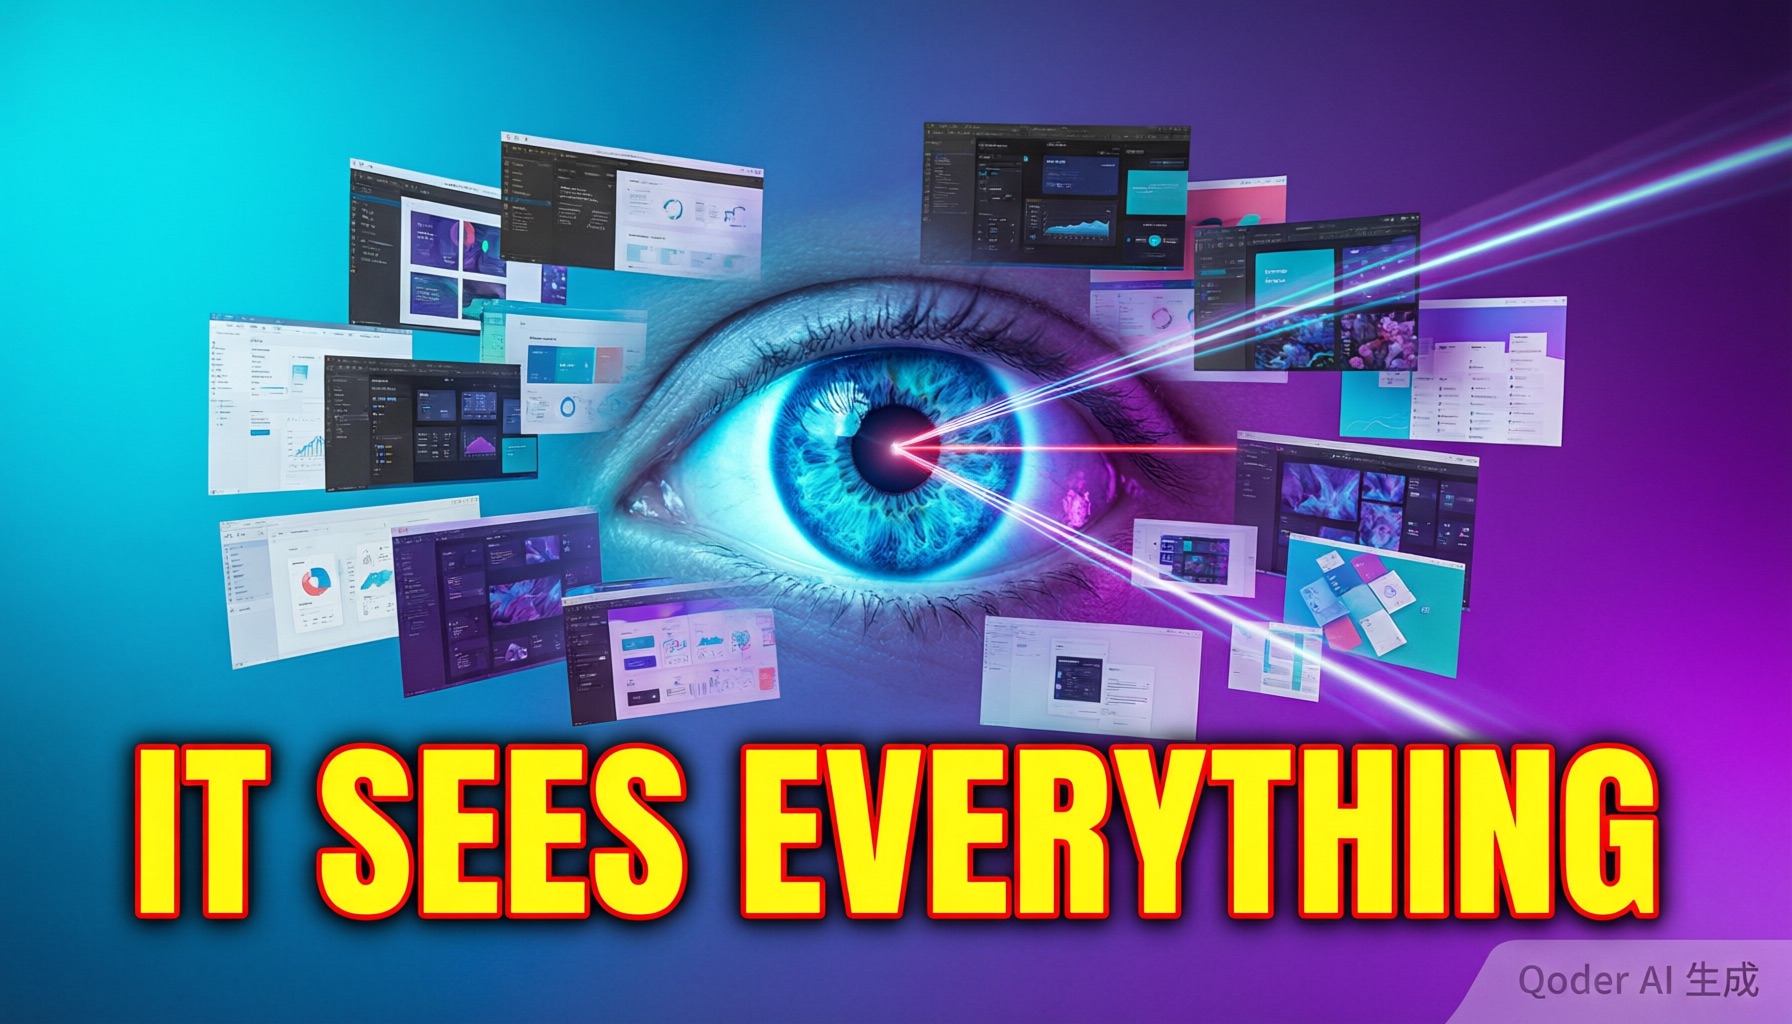
The GPT-5.6 Sol launch coverage had a predictable shape: speed numbers, Terminal-Bench scores, the Ultra mode drama. Vision got a paragraph at best. That's backwards — in my one-month daily usage, image-based tasks ended up being roughly a quarter of my Sol interactions, and it's the area where the gap over my previous default model was biggest.
So I ran a structured evaluation: 40 real images across four categories — UI screenshots, architecture diagrams, charts, and the ugly stuff (photos of whiteboards, low-res scans, dark-mode terminal screenshots). No stock-photo demos; everything came from actual projects.

Screenshot to Code: The Headline Test
Twelve UI screenshots, ranging from a clean marketing landing page to a dense admin dashboard. The task: reproduce each as working React + Tailwind code.
Results were genuinely impressive on structure. Sol nailed the layout hierarchy — flex directions, grid splits, component nesting — on first pass in 10 of 12 cases. It correctly inferred interactive states (hover cards, active tabs) from visual cues like color differences. The two failures were both dark-mode dashboards with subtle border distinctions, where Sol merged separate panels into one.
Where every model, including Sol, still falls short: exact spacing values, specific border radii, and typography. Treat the first pass as a structural skeleton — it saves 70% of the work, but the final 30% is still yours. The workflow that worked best: screenshot → Sol structural pass → feed a cropped problem region back with "fix only this area." Two iterations consistently landed a production-quality result.

Diagrams, Charts, and the Ugly Cases
Architecture diagrams
Eight system architecture diagrams, all converted to Mermaid syntax. Sol handled labeled boxes and arrows well, and even inferred directional semantics (sync vs async) from arrow styles in six of eight. The misses: diagrams where text ran through connector lines, and one hand-drawn whiteboard photo it confidently misread.
Charts
Fourteen charts — data extraction to structured tables. Standard bar/line/pie charts: 12 of 14 fully correct, including reading axis scales and legend mappings. The failures were a dense 6-series line chart with overlapping lines and a logarithmic-scale chart where Sol treated log spacing as linear. If your charts are exotic, sanity-check the numbers.
The ugly cases
Photos of whiteboards, a low-res scan of a printed spec, dark terminal screenshots at 4K: Sol handled all of them better than expected. The whiteboard handwriting was the clear weak spot — printed and typed text is reliable, handwriting is a coin flip.
The Prompt Patterns That Improved Everything
Three patterns moved my vision results from "decent" to "reliable":
- Declare the image type first. "This is a screenshot of a web dashboard" outperformed bare image + task every time. It anchors the interpretation frame and cut hallucinated elements roughly in half in my tests.
- Ask for a description before the transformation. For screenshot-to-code, a two-step prompt ("first list every component you see, then generate code") produced noticeably better output than one-shot requests. The enumeration step forces systematic visual parsing.
- Iterate with crops, not full re-runs. When one region is wrong, crop and resend just that region with context. It's faster, cheaper, and avoids the model "improving" parts that were already correct.
Also worth knowing: downscaling 4K screenshots to ~1600px wide before sending saves meaningful token cost with no measurable accuracy loss for UI work. Sol's vision doesn't benefit from resolution beyond what a human would need to read the screen.
Vision Verdict
GPT-5.6 Sol's vision isn't the best on the market for pure OCR or exotic imagery — but for the developer-workload sweet spot (screenshots, clean diagrams, standard charts), it's fast, cheap enough to iterate freely, and accurate enough to change your workflow. The speed matters here more than in text tasks: when an image analysis takes 3 seconds, you stop hesitating about whether a task is "worth" an API call.
If your work involves converting existing visual artifacts into code or structured data, Sol earns its keep on vision alone. Pair it with the prompt engineering guide for the text-side patterns, and check the API developer guide for wiring image inputs into your pipeline.
Frequently Asked Questions
How good is GPT-5.6 Sol at converting screenshots to code?
On clean UI screenshots, Sol reproduced layouts with roughly 85-90% structural accuracy on the first pass — spacing, flex layouts, and component hierarchy were consistently right. Fine details like exact pixel values, subtle shadows, and specific fonts always need a second iteration.
Can GPT-5.6 Sol read charts and graphs accurately?
Yes for standard bar, line, and pie charts with clear labels — it extracted data tables correctly in 12 of my 14 chart tests. It struggles with 3D charts, hand-drawn diagrams, and dense multi-series plots where lines overlap.
Does vision input cost more tokens with GPT-5.6 Sol?
Images are tokenized by resolution — a typical 1080p screenshot consumes roughly 750-1,100 tokens. Downscaling large screenshots before sending saves cost without losing much accuracy for UI work.